How to insert a diagram into a question
Introduction
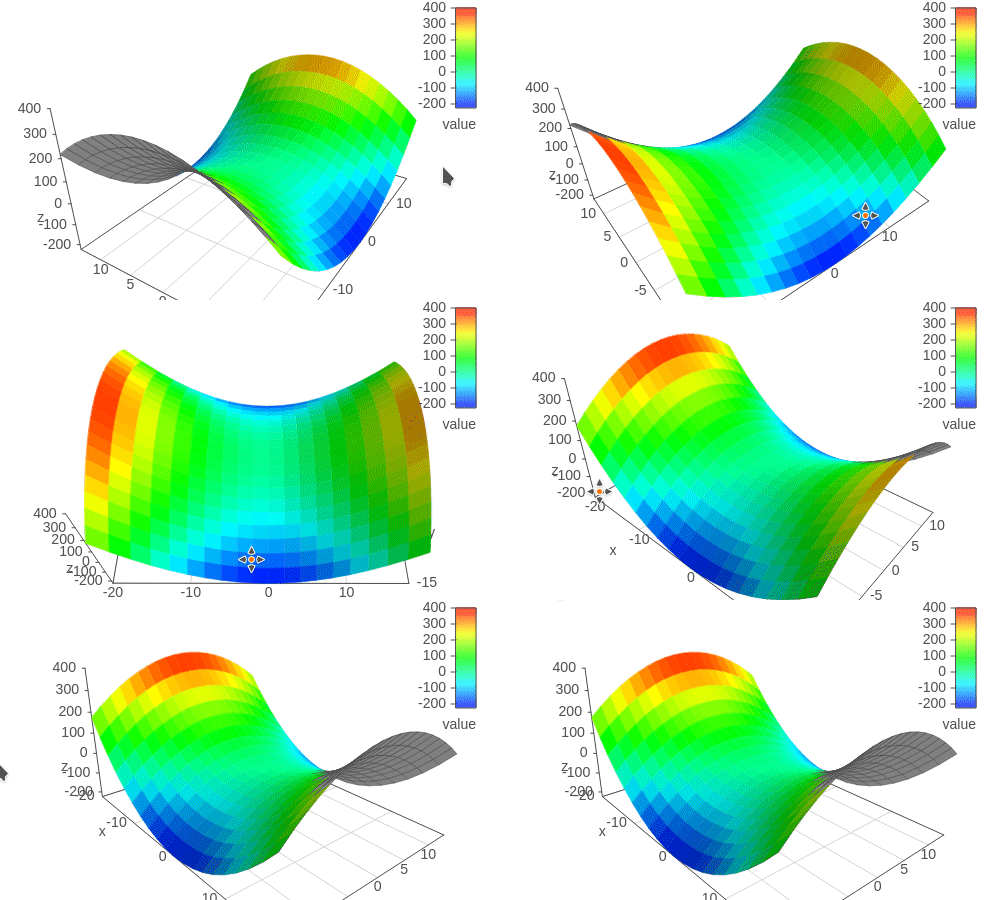
There are some concepts which are highly abstract or too difficult to describe verbally. Imagine: as a math teacher, sometime you need to present two or three dimension graphs of a particular function, say
But most of the time graphs will be as complicated as
Not only math, there are many awesome subjects in the reality you can't simply describe them onto a blackboard 2D way. Here we provide the tools for you the generate professional diagrams. You can put them into printable handouts easily or drag and drop on the screen, which the diagram will update simultaneously.
Principles and Concepts
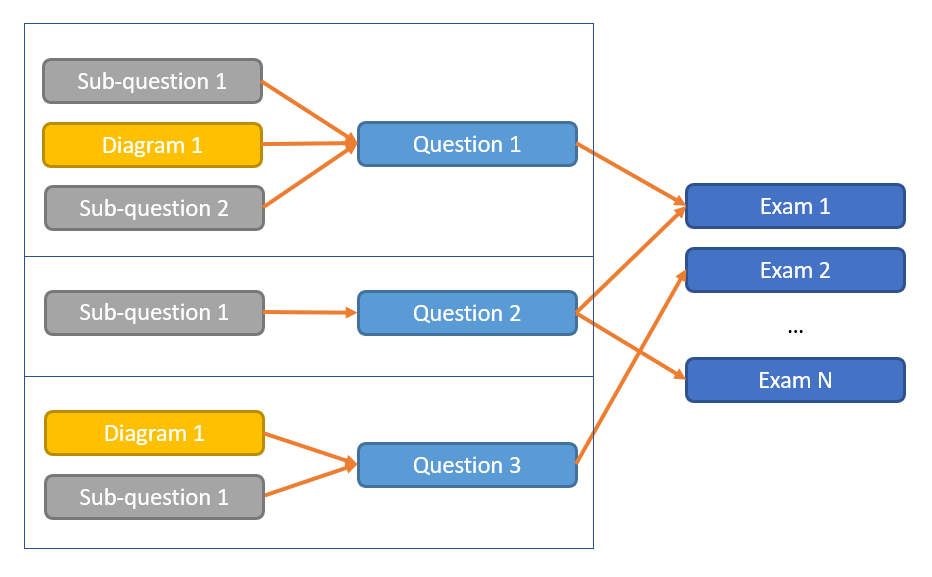
As mentioned in "How to create an exam paper", questions are separated in "question files". One "exam file" can contains several "question files". A "question file" can be added to several exam files.
In one "question file" you can add sub-questions and diagrams. If you want to insert diagrams, you need to create a "question file" first and add the question file into the exam file.

Here is the list of diagrams we supported:
Steps
First, choose the type of diagrams you want.

The edit window will pop up. After changing anything, just press the "Reset" button in the right hand side of the window to see the result.

Interact with diagrams
Sometime you may want to change the point of view or some parameters of the diagram to present some different cases. In this case you can try to interact with the multimedia diagram by using such as dragging and dropping.

Export to Word
Since a printable document can't display diagrams in such an interactive way, we convert them into images for you to print.
After saving, it takes some time for the system to generate the printable images for each multimedia diagram. Before finishing, you will see the following if you try to export to Word format:

Usually, it takes around 1 minute to do so (but it varies if there are more users saving their diagrams). If it doesn't work, you can change settings of the diagram a little bit and save again for triggering this generation process. If it fails, you can report this problem to us:

Conclusion
By using our system, you can generate professional diagrams just by a few clicks. Therefore it is easy for you to demostrate concepts to your student from the screen or print it out.
We will add add more and more diagrams continuously. Please suggest us if those of them can't satisfy your need.