<< BACK


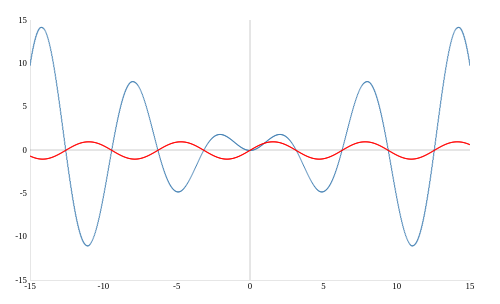
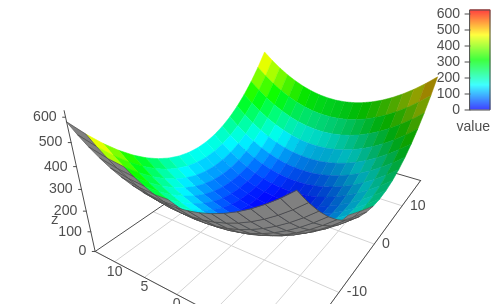
Graphs of functions (2D / 3D) (type of diagram)
Description
The graph of a function
(From: Graphs of Functions - Math 111 - COLLEGE ALGEBRA)


Subjects can be applied
- Algebra and other math-related disciplines
- Disciplines which present concepts by using functions (such as physics, economic, etc.)
Scope
- Insert into questions
- Generate Exam papers and export to Word format (by adding questions into exam papers)
- Broadcast teaching materials to students' mobile phone or computer (by adding questions into broadcast)